Intel Developer Cloud Telemetry数据分析(二)
 openlab_4276841a
更新于 3年前
openlab_4276841a
更新于 3年前
1. Telemetry 介绍
上一篇文章我介绍了Intel® Developer Cloud Telemetry的概念和功能,通过该功能的数据分析,可以更好地优化产品方案。有关Telemetry 的工作原理和集成方法,我将在这篇文章里细细解释。耐心看下去,相信您肯定可以在自己应用中开启这个功能。2. Telemetry收集流程
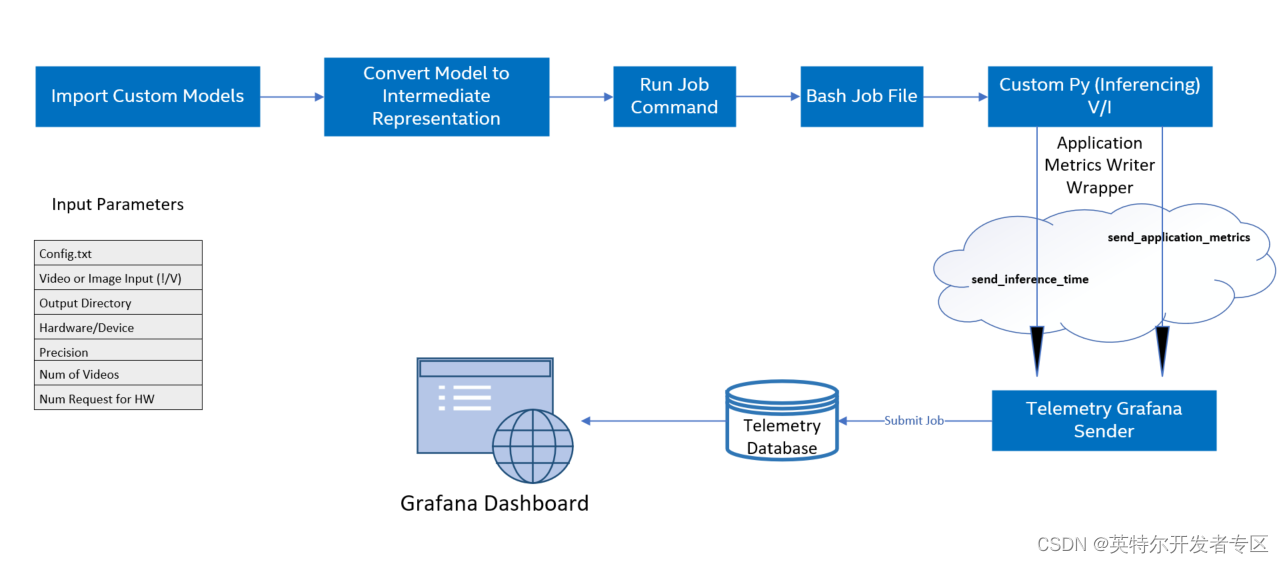
图 1-2 Telemetry收集数据流程
概括来说,对自定义AI模型上运行模型优化,由Intel® OpenVINO进行推理,完成对AI模型的推理后,您就可以获得计算节点上可用的遥测指标。具体步骤如下:
1. 导入所有自定义模型文件(tensorflow、kaldi、onnx 等)
2. 使用模型优化器以必要的精度创建模型中间表示 (IR) 文件
3. 创建用于在计算节点上提交运行推理的作业文件 (.sh)
4. 使用 Application Metrics Writer 启用遥测
5. 为不同的计算节点提交作业并监控作业状态直到完成(提交作业会调用bash和自定义python文件)
6. 在遥测仪表板上显示模型指标
注意:流程里不止包含Telemetry。而是AI应用在DevCloud上运行的流程,以便您可以了解Telemetry功能在应用里的位置。
参考:Enabling telemetry for custom models in Intel DevCloud for the Edge - Embedded.com
3. Telemetry集成
这次依然选择object-detection-python实例来介绍集成方法,应用程序的 python 代码中调用了applicationMetricWriter模块向Telemetry传递数据指标如,帧率、推理时间、模型名称、推理硬件信息,下面通过具体代码来展示详细信息。Step1. 登录Jupyter Lab
登录Intel® Developer Cloud主页后,点击“Bare Metal Deployment”的“Get Started”按钮,进入Jupyter Lab开发环境。在左侧目录导航栏选择这个路径:Reference-samples/iot-devcloud/openvino-dev-latest/developer-samples/python/,然后找到object-detection-python应用。
Step2. 程序源码分析
直接打开object_detection.py,可以看到在文件开头部分导入了applicationMetricWriter模块。我们可以在Jupyter notebook里直接查看它的函数。方法如下:
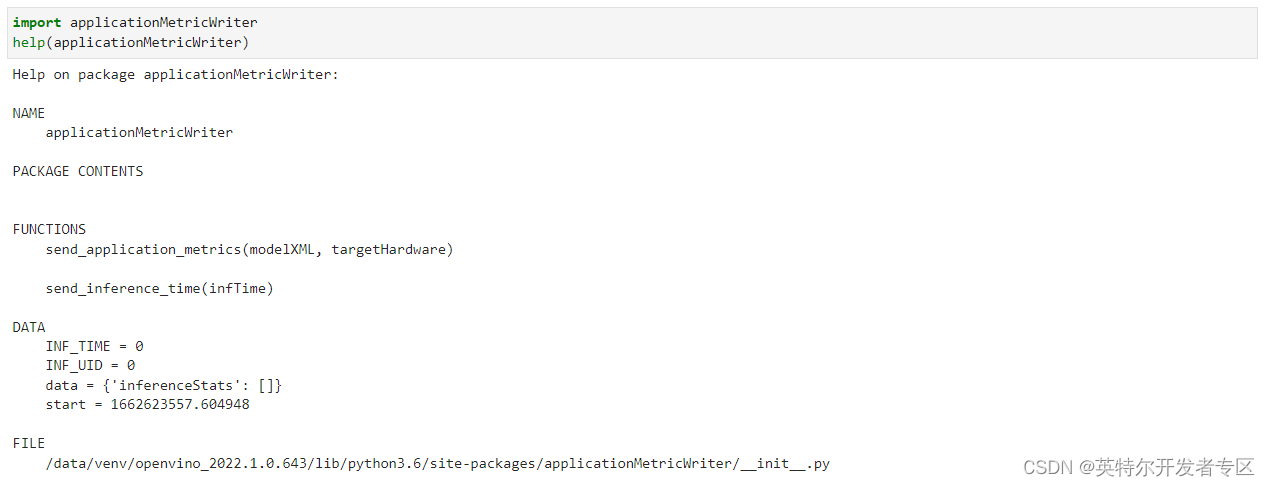
图 3-1 在Jupyter notebook里查看函数
可以看到它只有两个函数,使用起来非常的简单,我们来逐一介绍一下这两个函数。send_inference_time() 用来向Telemetry 数据发送每一帧推送所消耗的时间,唯一要注意的是每一帧哦。这就要求你能区分每一帧推理的时间。如果你选择async模式,就需要考虑是不是适用了。 send_application_metrics 主要传递的是模型的名字和推理设备的名字,以便于你能更好地标记这个任务。
看到这你估计跟我刚开始一样,怎么没有看到上传CPU, GPU, Thermal 等数据上传呢。其实是因为这些数据都是通用的,这块就没有必要放在用户侧来每次都重复写一遍,在后端直接默认做了。从这里我们可以看到,最重要的数据还是推理时间的上传。
现在这两个函数在程序里的调用时机,这里我注释了没有必要的代码,以方便观察。
#!/usr/bin/env python

import applicationMetricWriter

...

def main():

...

try:

infer_time_start = time.time()

with open(processed_vid, "rb") as data:

while frame_count < video_len:

byte = data.read(CHUNKSIZE)

if not byte == b"":

deserialized_bytes = np.frombuffer(byte, dtype=np.uint8)

in_frame = np.reshape(deserialized_bytes, newshape=(n, c, h, w))

inf_time = time.time()

exec_net.start_async(request_id=current_inference,inputs={input_blob: in_frame})

# Retrieve the output of an earlier inference request

if previous_inference >= 0:

status = infer_requests[previous_inference].wait()

if status is not 0:

raise Exception("Infer request not completed successfully")

det_time = time.time() - inf_time

applicationMetricWriter.send_inference_time(det_time*1000)

res = output_postprocessor(exec_net.requests[previous_inference].output_blobs)

processBoxes(frame_count, res, label***ap, args.prob_threshold, width, height, result_file)

frame_count += 1

…

applicationMetricWriter.send_application_metric***odel_xml, args.device)
Step3. Telemetry 数据访问
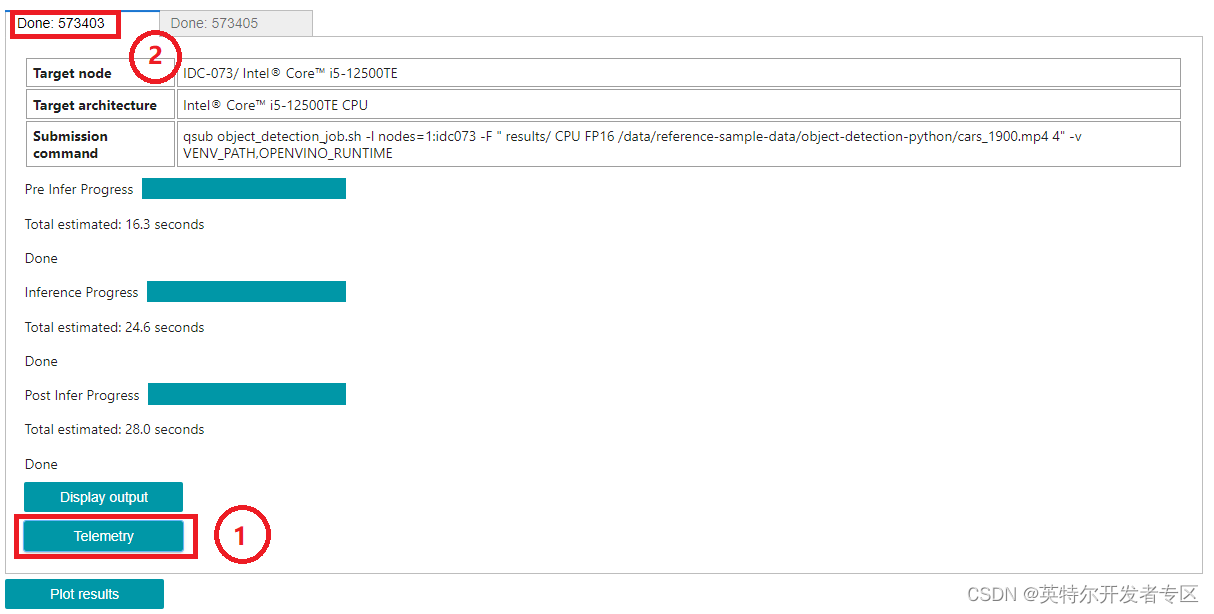
等应用程序在边缘节点运行结束,我们就可以去查看Telemetry的数据了。数据的连接你可以参考这个object-detection-python里的方法,直接点击1Telemetry按键获取连接方式。
图 3-2 Telemetry地址
当然您也可以自己手动生成这样一个连接,注意上图中2框处的ID号。使用Telemetry 服务器地址拼接该ID号,即可访问该数据。
Loading... + ID
比如:Loading...
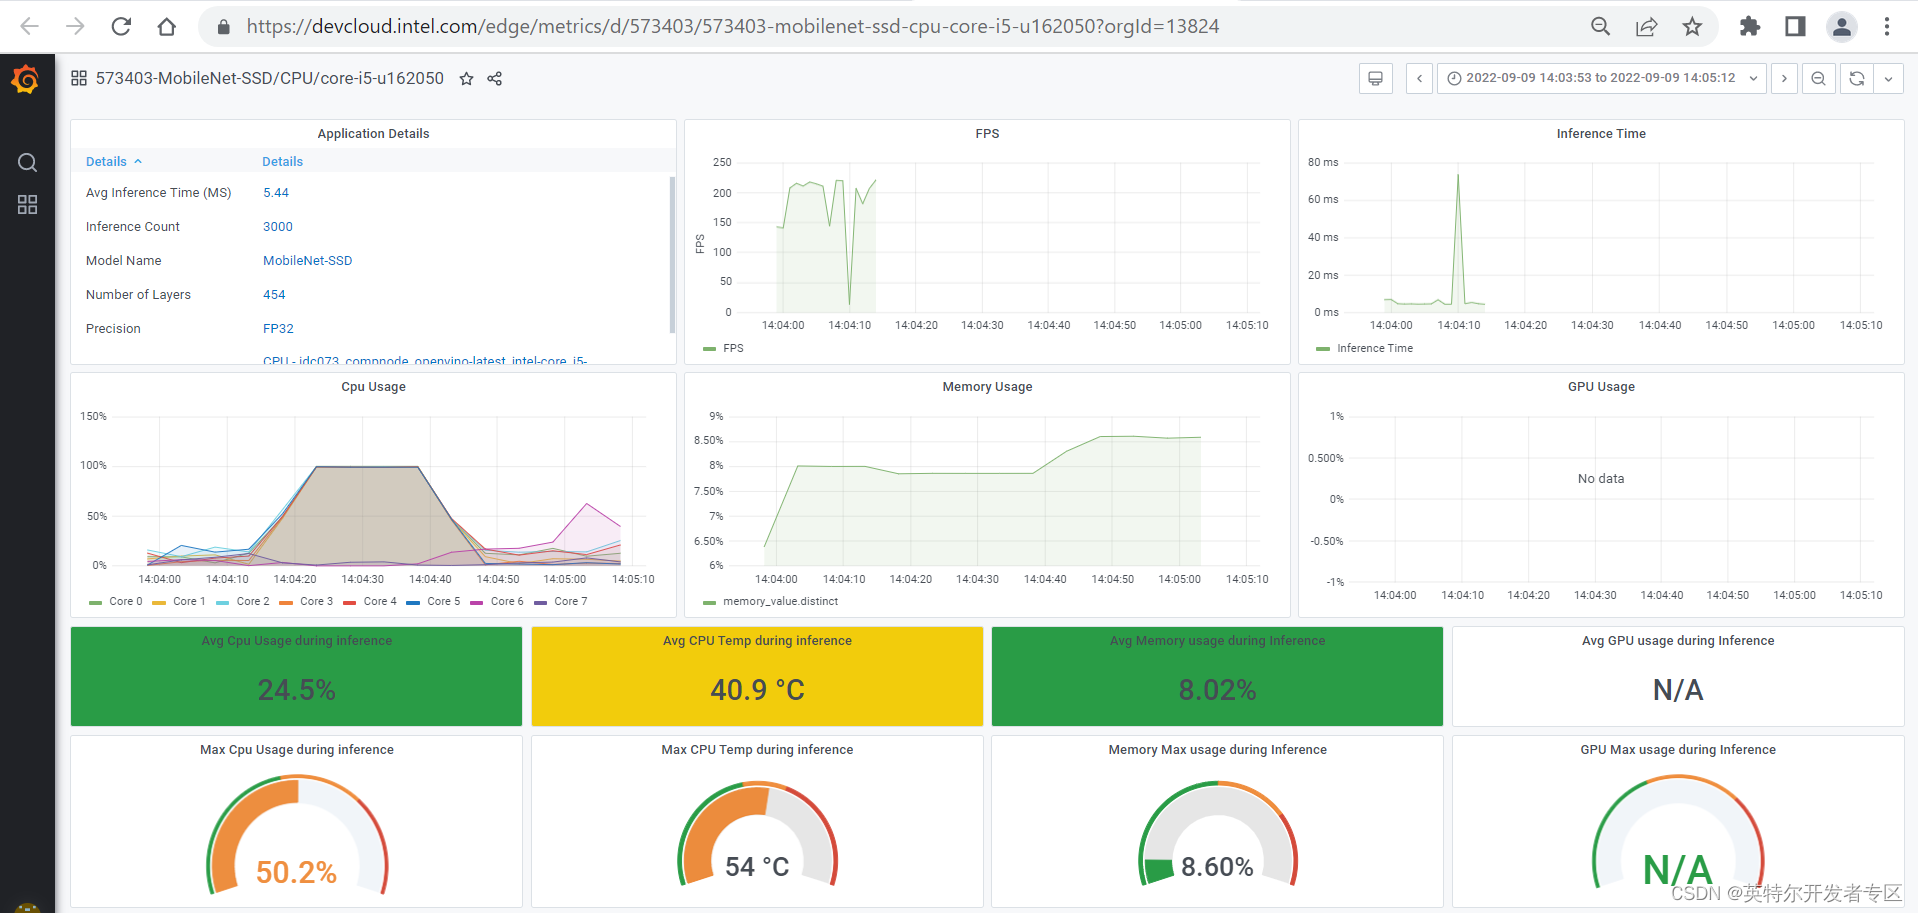
访问该路径即可获取Telemetry 的数据了。
图 3-3 Telemetry 界面
4. 总结
看到这相信您一定理解了Intel® Developer Cloud Telemetry 的集成方法了,它并没有我们想象的那么复杂。我这里总结出来,只是为了方便刚开始接触这块的您更快上手,不用花费太多精力就可以更快的把事情搞定。如果您在使用过程中有碰到问题,期待一起交流。这篇就到这吧。
0个评论